Overview
Reverse auctions can help procurement teams achieve great savings. Conducting an auction alone does not necessarily ensure good procurement results. The organization should gain insights into expenses, supplier performance, and cost-saving analysis. Without sourcing KPIs, a good competitive bidding process can also give poor results.
To overcome these challenges, businesses need procurement analytics and KPIs. Procurement analytics allows buyers to gain insight into purchase history, supplier performance, expenses, and savings opportunities. KPIs enable teams to measure whether the sourcing process has achieved the expected outcome.
By using procurement analytics, measurements, and reverse auctions together, companies can make informed decisions, increase supplier competition, and save costs.
Overview of Reverse Auction
A reverse auction is a type of sourcing where suppliers compete to offer the best prices for the buyer’s requirements. Unlike an ordinary auction that involves buyers competing by raising their offers, suppliers compete by reducing prices in a reverse auction.
A buyer first defines the requirements, specifications, quantities, delivery expectations, and business conditions. Qualified suppliers then submit bids during the auction. This competition lowers the prices. It helps buyers identify the competitive offer.
The price is not the only consideration. Factors such as material quality, reliability, compliance, capacity, and others may affect the result of the auction.
This is why procurement teams need data before, during, and after the event.
Why Procurement Analytics Matters Before a Reverse Auction
A successful reverse auction starts well before suppliers enter their bids.
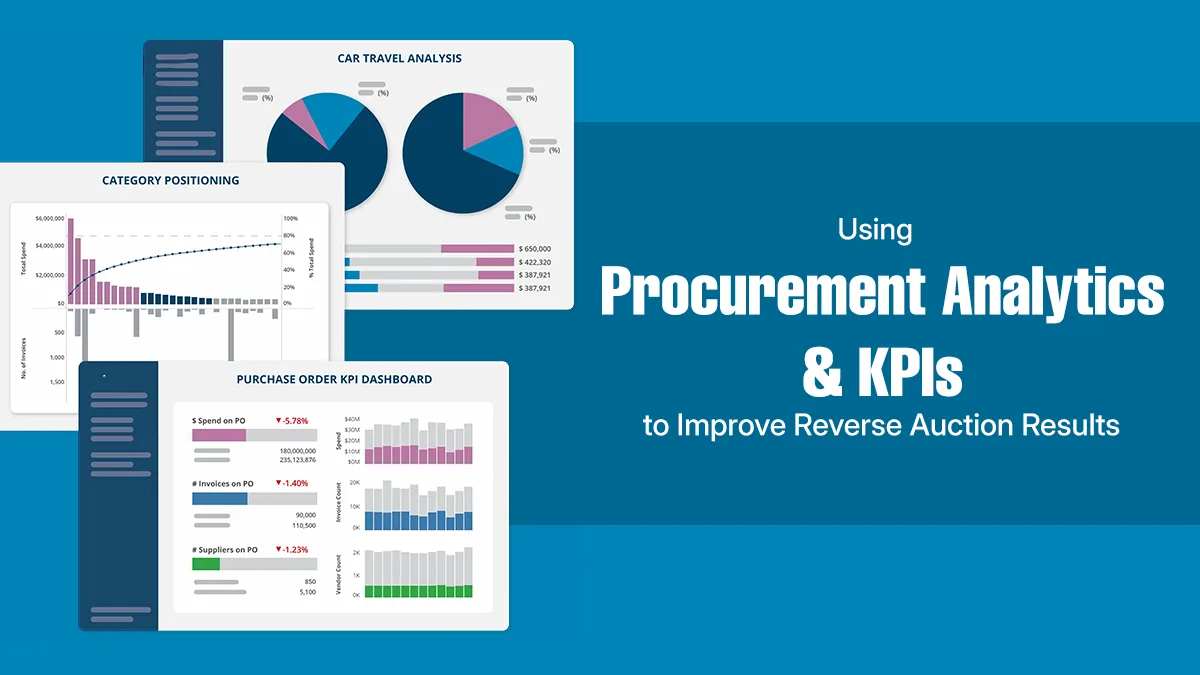
Procurement analytics gives buyers visibility into historical spending, supplier pricing, purchasing volumes, contract performance, and category-level trends. It helps procurement professionals participate in the bidding process with clear expectations.
Know the Spending History
Spending analysis allows procurement professionals to get insight into the spending volumes, the sources, and the suppliers.
For instance, an organization can learn that the same product is being purchased by different departments from several suppliers at different costs.
This information is useful for consolidating demand and creating a better sourcing event.
Identify Savings Opportunities
Past purchasing data can help identify product categories where the price is inconsistent and the suppliers are offering varying prices.
The procurement team can evaluate parameters such as
Current prices
Past prices
Quantity purchased
Supplier concentration
Contract prices
Changes in prices
Past sourcing results
It helps businesses create an accurate baseline for conducting the reverse auction.
Businesses can figure out how much savings are possible with real procurement data.
Improve Supplier Selection
Not every supplier should automatically participate in a reverse auction. Procurement analytics helps identify suppliers by considering criteria such as their previous performance, competitive pricing, delivery, quality, and compliance.
Procurement analytics ensure that procurement departments do not rely on suppliers that provide the lowest prices.
Procurement KPIs That Matter for Reverse Auctions
Once the team has identified eligible suppliers for their requirements, they need measurable KPIs to evaluate the reverse auction.
The right procurement metrics help organizations understand whether reverse auctions are improving sourcing outcomes.
Cost Savings
The cost-saving metric is the most critical KPI in a reverse auction.
It involves measuring the difference between the baseline cost and the awarded price. Assume that the baseline cost for a certain category is USD 1 million and the awarded cost is USD 900,000; hence, there have been savings worth USD 100,000.
Procurement departments should clearly define the baseline cost. Comparing the finalized price with an old price can make savings appear larger.
Savings Percentage
The savings percentage shows the relative improvement against the baseline.
Savings % = (Baseline Cost − Final Cost) / Baseline Cost × 100
This KPI makes it easier to compare sourcing events of different sizes.
Auction Participation Rate
Supplier participation may affect the competitiveness of the reverse auction process.
Low supplier participation may indicate an unattractive requirement, a lack of potential suppliers, or qualification requirements affecting competition.
Participation statistics help procurement professionals realize whether they generate enough competitiveness.
Bid Reduction
Bid reduction is the percentage by which the bidders reduced their offers within the process.
High bid reductions may suggest good competition, while low participation indicates that the bidders do not have much flexibility for reducing their prices.
Bid reduction should always be considered alongside market conditions and supplier margins.
Supplier Performance
Price is only one part of procurement performance.
The supplier offering the lowest price can provide late deliveries and give poor-quality products. It can end up costing the business more than other suppliers.
The procurement team evaluates the supplier's KPIs, such as
Timeliness
Quality
Compliance with contracts
Accuracy of orders
Responsiveness
Service performance
This will assist the procurement team in making more balanced sourcing decisions.
Using Procurement Analytics During the Auction
Analytics does not end once the reverse auction is initiated.
The real-time data helps procurement teams understand the number of suppliers who are responding and the status of the bids. If a bid has only one or two active suppliers, the procurement team can consider checking if there is sufficient competition.
The procurement team should never rely solely on the real-time lowest bid, and it should take into consideration the value that the supplier brings.
In complicated products, other considerations like transport, quality, delivery, payment, and service may add to the total cost.
Transforming Procurement Data into Procurement Optimization
The true value of analytics lies in its application to improve decision-making in the future.
Historical auction data can help procurement departments optimize supplier strategy and design better auctions. It also helps them decide on appropriate categories for reverse auctions.
For example, analytics may show that reverse auctions work particularly well for standardized products with multiple qualified suppliers and strong price competition.
At the same time, the data may show that highly customized products perform poorly in auctions because suppliers compete on more than price.
This helps organizations select the right procurement method for each category rather than using reverse auctions for everything.
How to Build a KPI-Driven Reverse Auction Strategy
A strong approach can be divided into four stages.
Analyze
Start with spend analytics. Understand historical purchases, suppliers, prices, volumes, and category trends.
Prepare
Define the sourcing requirements, identify qualified suppliers, establish the baseline, and set realistic savings targets.
Execute
Run the reverse auction while monitoring supplier participation, bidding activity, and pricing movements.
Measure and Improve
After the completion of the sourcing event, compare the performance against the benchmark and goals.
It leads to a continuous improvement process, where each sourcing event helps with the planning and execution of future reverse auctions.
Conclusion
Reverse auctions are effective in cutting costs, although it highly depends on the quality of pre-auction and post-auction decisions. Procurement analytics enable the organization to get insights into its spend analytics, suppliers, prices, and cost-saving opportunities. Procurement KPIs will help assess the performance of the sourcing process and take the required actions.
By integrating procurement dashboards, spend analytics, supplier performance information, and benchmarking, an organization can establish a measurable strategic sourcing process.